Are Home Prices Going Up or Down? That Depends…

Are Home Prices Going Up or Down? That Depends….

Media coverage about what’s happening with home prices can be confusing. A large part of that is due to the type of data being used and what they’re choosing to draw attention to. For home prices, there are two different methods used to compare home prices over different time periods: year-over-year (Y-O-Y) and month-over-month (M-O-M). Here’s an explanation of each. 

Year-over-Year (Y-O-Y):
  • This comparison measures the change in home prices from the same month or quarter in the previous year. For example, if you’re comparing Y-O-Y home prices for April 2023, you would compare them to the home prices for April 2022.
  • Y-O-Y comparisons focus on changes over a one-year period, providing a more comprehensive view of long-term trends. They are usually useful for evaluating annual growth rates and determining if the market is generally appreciating or depreciating.
Month-over-Month (M-O-M):
  • This comparison measures the change in home prices from one month to the next. For instance, if you’re comparing M-O-M home prices for April 2023, you would compare them to the home prices for March 2023.
  • Meanwhile, M-O-M comparisons analyze changes within a single month, giving a more immediate snapshot of short-term movements and price fluctuations. They are often used to track immediate shifts in demand and supply, seasonal trends, or the impact of specific events on the housing market.

The key difference between Y-O-Y and M-O-M comparisons lies in the time frame being assessed. Both approaches have their own merits and serve different purposes depending on the specific analysis required.

Why Is This Distinction So Important Right Now? 

We’re about to enter a few months when home prices could possibly be lower than they were the same month last year. April, May, and June of 2022 were three of the best months for home prices in the history of the American housing market. Those same months this year might not measure up. That means, the Y-O-Y comparison will probably show values are depreciating. The numbers for April seem to suggest that’s what we’ll see in the months ahead (see graph below):

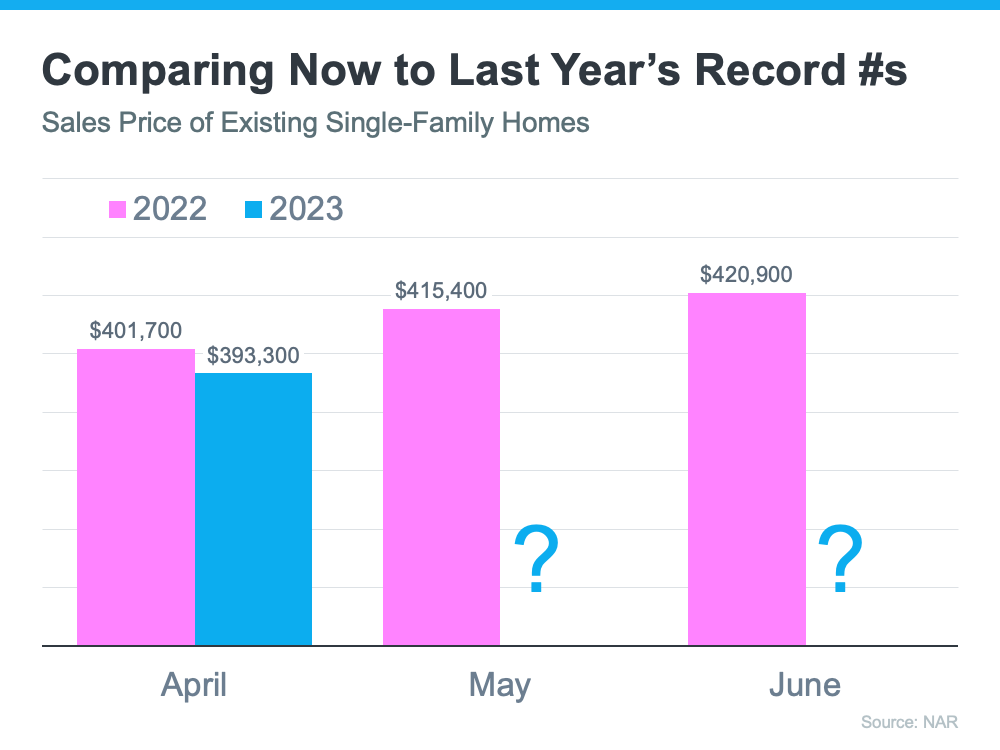
That’ll generate troubling headlines that say home values are falling. That’ll be accurate on a Y-O-Y basis. And, those headlines will lead many consumers to believe that home values are currently cascading downward.

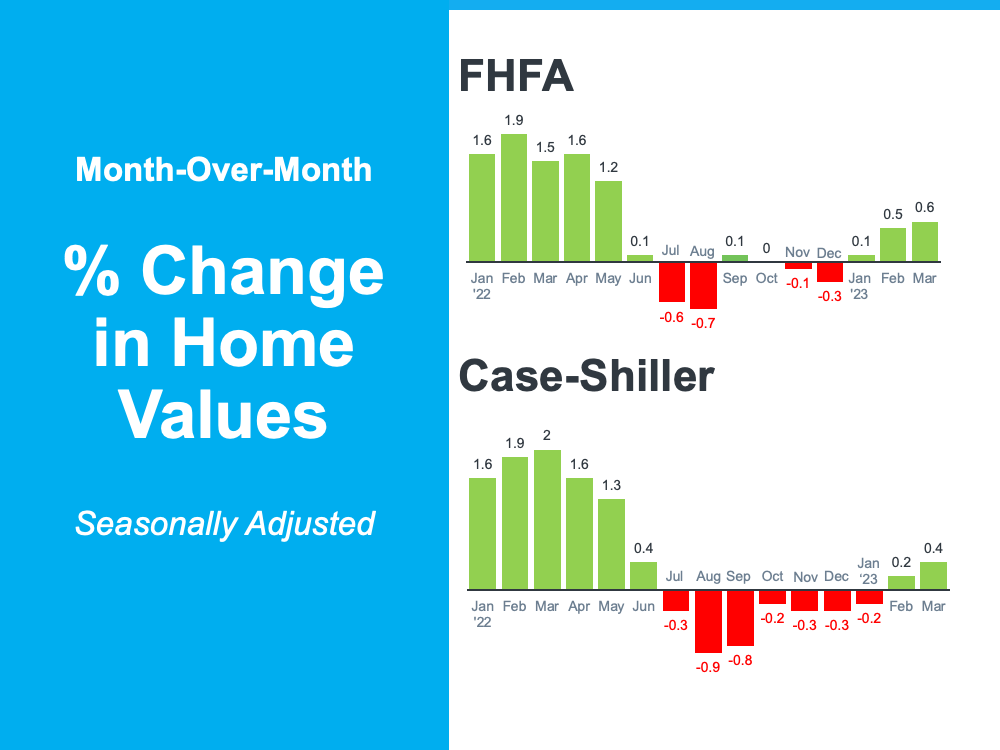
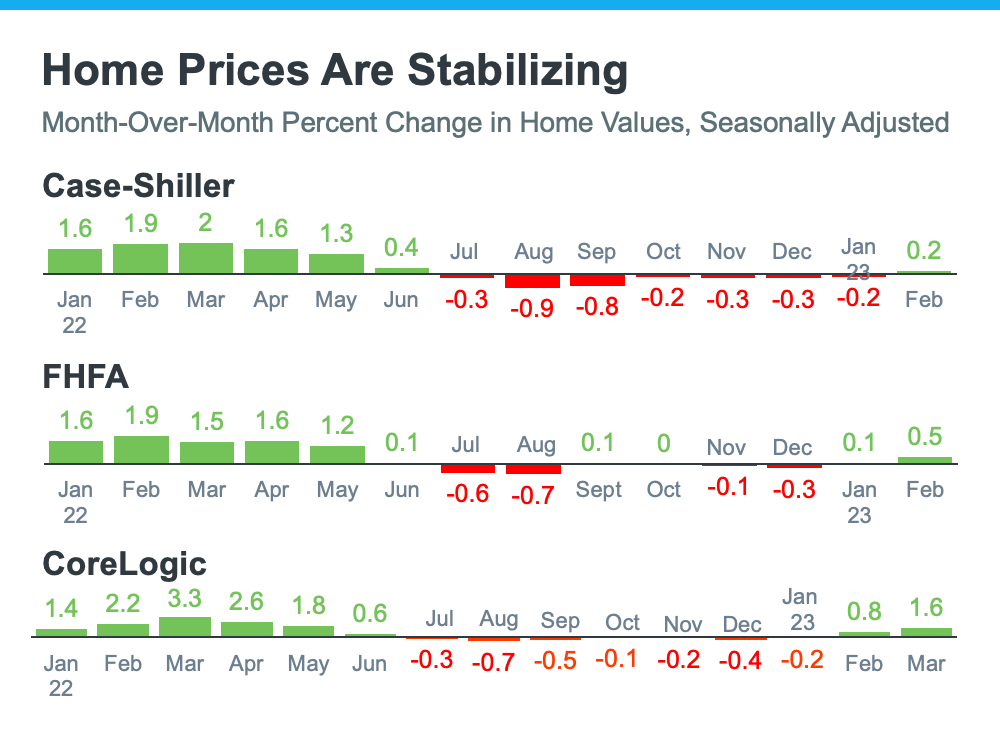
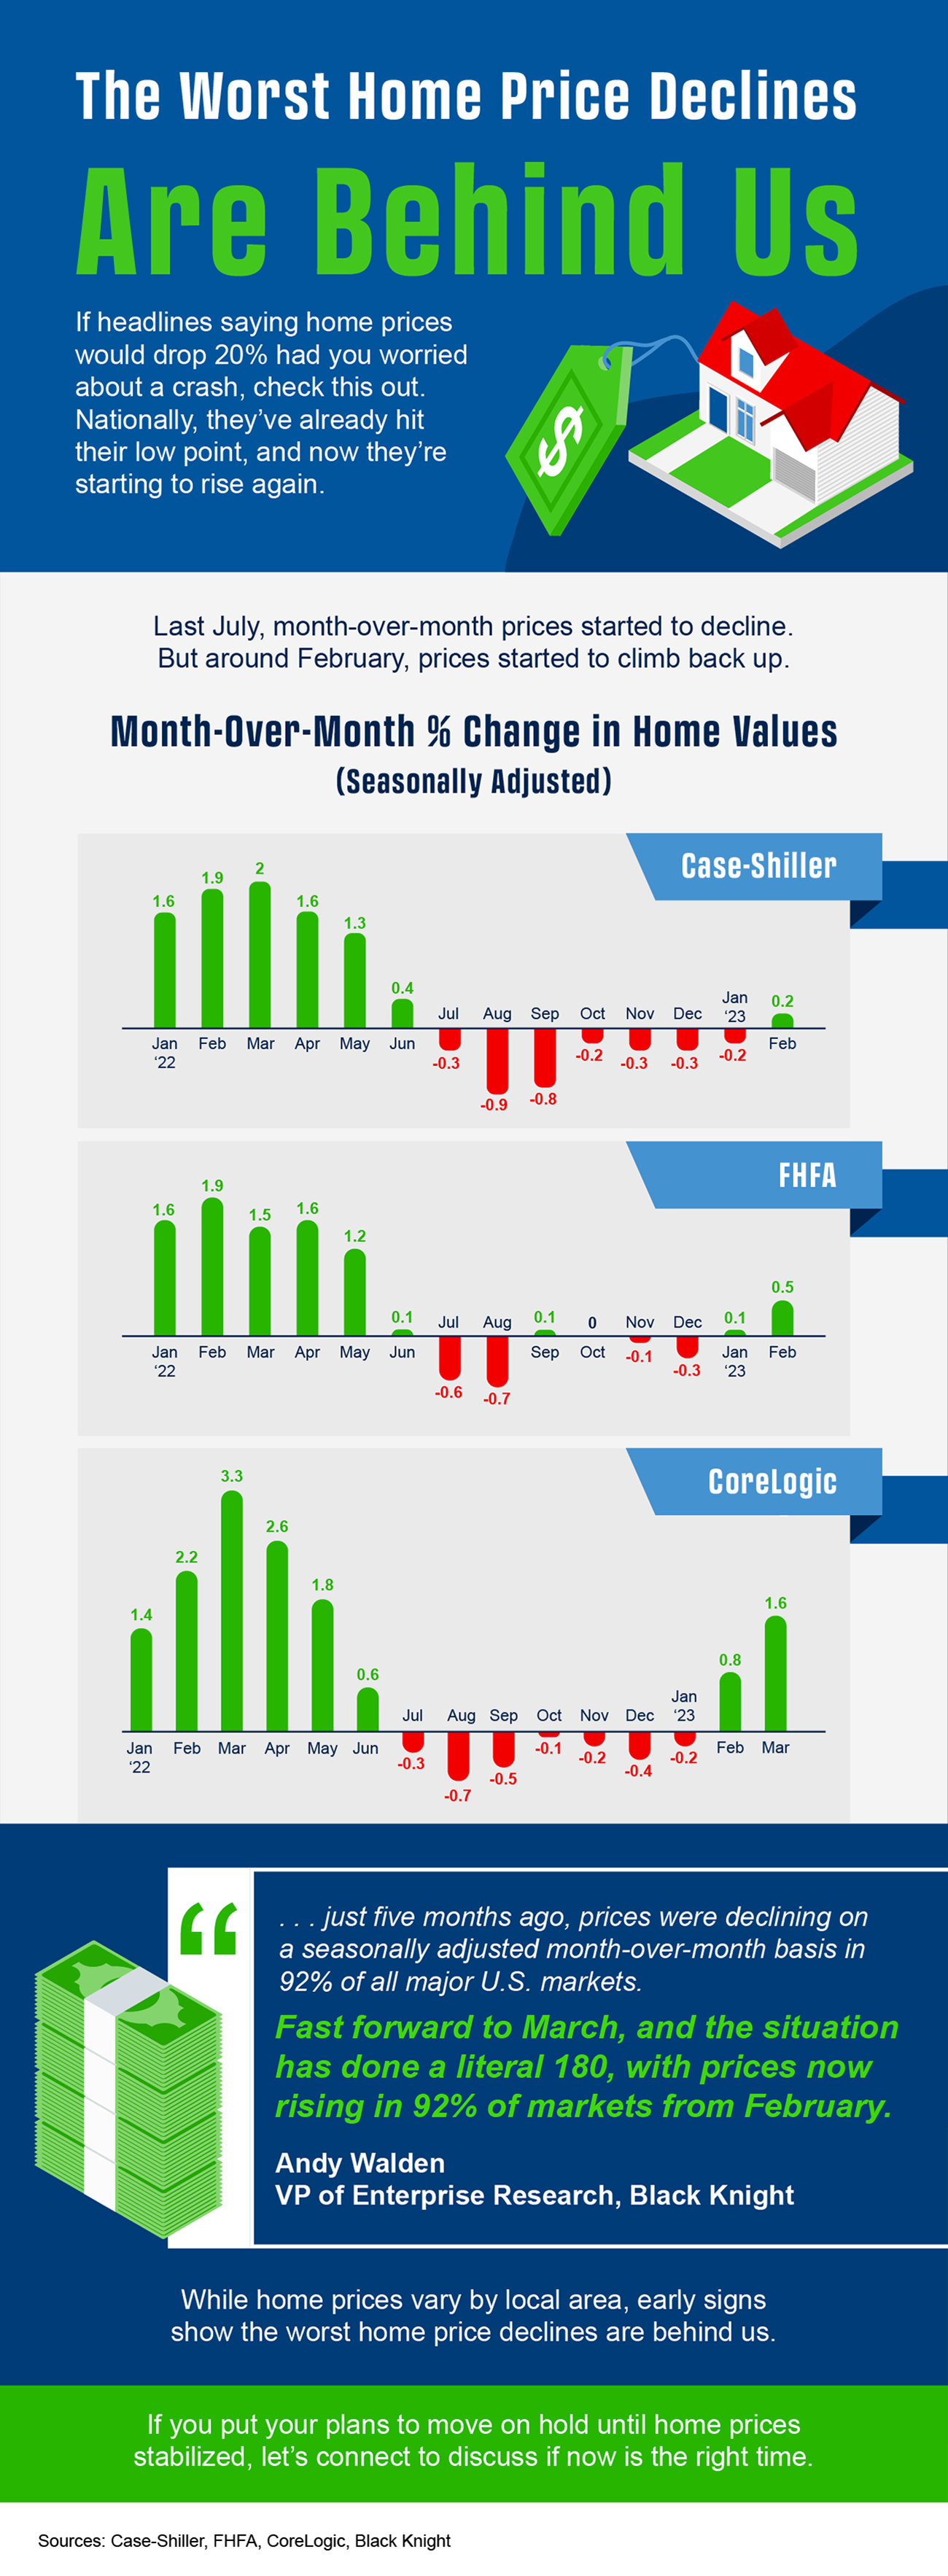
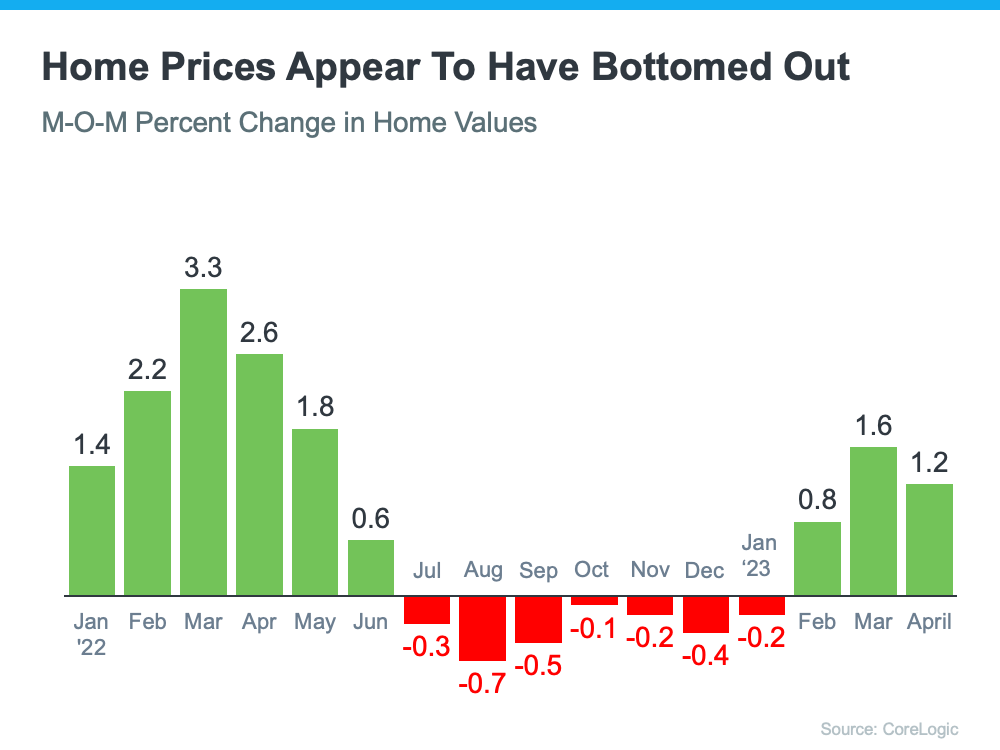
However, on a closer look at M-O-M home prices, we can see prices have actually been appreciating for the last several months. Those M-O-M numbers more accurately reflect what’s truly happening with home values: after several months of depreciation, it appears we’ve hit bottom and are bouncing back.

Here’s an example of M-O-M home price movements for the last 16 months from the CoreLogic Home Price Insights report (see graph below):

Why Does This Matter to You?

So, if you’re hearing negative headlines about home prices, remember they may not be painting the full picture. For the next few months, we’ll be comparing prices to last year’s record peak, and that may make the Y-O-Y comparison feel more negative. But, if we look at the more immediate, M-O-M trends, we can see home prices are actually on the way back up.

There’s an advantage to buying a home now. You’ll buy at a discount from last year’s price and before prices start to pick up even more momentum. It’s called “buying at the bottom,” and that’s a good thing.

Bottom Line

If you have questions about what’s happening with home prices, or if you’re ready to buy before prices climb higher, connect with a local real estate agent.

Comments Off on Are Home Prices Going Up or Down? That Depends…

Oops! Home Prices Didn’t Crash After All

Oops! Home Prices Didn’t Crash After All.

During the fourth quarter of last year, many housing experts predicted home prices were going to crash this year. Here are a few of those forecasts:

Jeremy Siegel, Russell E. Palmer Professor Emeritus of Finance at the Wharton School of Business:

“I expect housing prices fall 10% to 15%, and the housing prices are accelerating on the downside.”

Mark Zandi, Chief Economist at Moody’s Analytics:

“Buckle in. Assuming rates remain near their current 6.5% and the economy skirts recession, then national house prices will fall almost 10% peak-to-trough. Most of those declines will happen sooner rather than later. And house prices will fall 20% if there is a typical recession.” 

Goldman Sachs

“Housing is already cooling in the U.S., according to July data that was reported last week. As interest rates climb steadily higher, Goldman Sachs Research’s G-10 home price model suggests home prices will decline by around 5% to 10% from the peak in the U.S. . . . Economists at Goldman Sachs Research say there are risks that housing markets could decline more than their model suggests.”

The Bad News: It Rattled Consumer Confidence

These forecasts put doubt in the minds of many consumers about the strength of the residential real estate market. Evidence of this can be seen in the December Consumer Confidence Survey from Fannie Mae. It showed a larger percentage of Americans believed home prices would fall over the next 12 months than in any other December in the history of the survey (see graph below). That caused people to hesitate about their homebuying or selling plans as we entered the new year.

The Good News: Home Prices Never Crashed

However, home prices didn’t come crashing down and seem to be already rebounding from the minimal depreciation experienced over the last several months. 

In a report just released, Goldman Sachs explained:

“The global housing market seems to be stabilizing faster than expected despite months of rising mortgage rates, according to Goldman Sachs Research. House prices are defying expectations and are rising in major economies such as the U.S.,. . . ”

Those claims from Goldman Sachs were verified by the release last week of two indexes on home prices: Case-Shiller and the FHFA. Here are the numbers each reported:

Home values seem to have turned the corner and are headed back up.

Bottom Line

The housing market is much stronger than many think. To get a true evaluation of your local market, reach out to a trusted real estate professional.

Comments Off on Oops! Home Prices Didn’t Crash After All

Today’s Real Estate Market: The ‘Unicorns’ Have Galloped Off

Today’s Real Estate Market: The ‘Unicorns’ Have Galloped Off.

Comparing real estate metrics from one year to another can be challenging in a normal housing market. That’s due to possible variability in the market making the comparison less meaningful or accurate. Unpredictable events can have a significant impact on the circumstances and outcomes being compared. 

Comparing this year’s numbers to the two ‘unicorn’ years we just experienced is almost worthless. By ‘unicorn,’ this is the less common definition of the word:

“Something that is greatly desired but difficult or impossible to find.” 

The pandemic profoundly changed real estate over the last few years. The demand for a home of our own skyrocketed, and people needed a home office and big backyard. 

  • Waves of first-time and second-home buyers entered the market.
  • Already low mortgage rates were driven to historic lows. 
  • The forbearance plan all but eliminated foreclosures.
  • Home values reached appreciation levels never seen before.

It was a market that forever had been “greatly desired but difficult or impossible to find.” A ‘unicorn’ year.

Now, things are getting back to normal. The ‘unicorns’ have galloped off. 

Comparing today’s market to those years makes no sense. Here are three examples: 

Buyer Demand 

If you look at the headlines, you’d think there aren’t any buyers out there. We still sell over 10,000 houses a day in the United States. Of course, buyer demand is down from the two ‘unicorn’ years. But, according to ShowingTime, if we compare it to normal years (2017-2019), we can see that buyer activity is still strong (see graph below):

Home Prices

We can’t compare today’s home price increases to the last couple of years. According to Freddie Mac, 2020 and 2021 each had historic appreciation numbers. Here’s a graph also showing the more normal years (2017-2019):

We can see that we’re returning to more normal home value increases. There were several months of minimal depreciation in the second half of 2022. However, according to Fannie Mae, the market has returned to more normal appreciation in the first quarter of this year.

Foreclosures 

There have already been some startling headlines about the percentage increases in foreclosure filings. Of course, the percentages will be up. They are increases over historically low foreclosure rates. Here’s a graph with information from ATTOM, a property data provider:

There will be an increase over the numbers of the last three years now that the moratorium on foreclosures has ended. There are homeowners who lose their home to foreclosure every year, and it’s heartbreaking for those families. But, if we put the current numbers into perspective, we’ll realize that we’re actually going back to the normal filings from 2017-2019.

SBottom Line

There will be very unsettling headlines around the housing market this year. Most will come from inappropriate comparisons to the ‘unicorn’ years. A real estate professional is a great resource to help you keep everything in proper perspective.

Comments Off on Today’s Real Estate Market: The ‘Unicorns’ Have Galloped Off

What You Need To Know About Home Price News

What You Need To Know About Home Price News.

The National Association of Realtors (NAR) will release its latest Existing Home Sales Report tomorrow. The information it contains on home prices may cause some confusion and could even generate some troubling headlines. This all stems from the fact that NAR will report the median sales price, while other home price indices report repeat sales prices. The vast majority of the repeat sales indices show prices are starting to appreciate again. But the median price reported on Thursday may tell a different story. 

Here’s why using the median home price as a gauge of what’s happening with home values isn’t ideal right now. According to the Center for Real Estate Studies at Wichita State University:

“The median sale price measures the ‘middle’ price of homes that sold, meaning that half of the homes sold for a higher price and half sold for less. While this is a good measure of the typical sale price, it is not very useful for measuring home price appreciation because it is affected by the ‘composition’ of homes that have sold.

For example, if more lower-priced homes have sold recently, the median sale price would decline (because the “middle” home is now a lower-priced home), even if the value of each individual home is rising.”

People buy homes based on their monthly mortgage payment, not the price of the house. When mortgage rates go up, they have to buy a less expensive home to keep the monthly expense affordable. More ‘less-expensive’ houses are selling right now, and that’s causing the median price to decline. But that doesn’t mean any single house lost value. 

Even NAR, an organization that reports on median prices, acknowledges there are limitations to what this type of data can show you. NAR explains:

“Changes in the composition of sales can distort median price data.”

For clarification, here’s a simple explanation of median value:

  • You have three coins in your pocket. Line them up in ascending value (lowest to highest).
  • If you have one nickel and two dimes, the median value of the coins (the middle one) in your pocket is ten cents.
  • If you have two nickels and one dime, the median value of the coins in your pocket is now five cents.
  • In both cases, a nickel is still worth five cents and a dime is still worth ten cents. The value of each coin didn’t change.

The same thing applies to today’s real estate market.

SBottom Line

Actual home values are going up in most markets. The median value reported tomorrow might tell a different story. For a more in-depth understanding of home price movements, reach out to a local real estate professional.

Comments Off on What You Need To Know About Home Price News

The Worst Home Price Declines Are Behind Us

The Worst Home Price Declines Are Behind Us.

If you’re following the news today, you may feel a bit unsure about what’s happening with home prices and fear whether or not the worst is yet to come. That’s because today’s headlines are painting an unnecessarily negative picture. Contrary to those headlines, home prices aren’t in a freefall. The latest data tells a very different and much more positive story. Local home price trends still vary by market, but here’s what the national data tells us.

If we take a year-over-year view, home prices stayed positive – they just appreciated more slowly than they did at the peak of the pandemic. To get a more detailed picture of some of the trends in the market, we need to look at monthly data. 

The monthly graphs below use recent reports from three sources to show that the worst home price declines are already behind us, and prices are on their way back up nationally.

The story this more detailed monthly view tells us is that the last year has been a tale of two halves in the housing market. In the first half of 2022, home prices were climbing, and they peaked in June. Then, in July, home prices started to decline (shown in red in the graphs above). And by roughly August or September, the trend began to stabilize. As we look at the most recent data for the early part of 2023, these graphs also show a recent rebound in momentum with prices ticking back up. Monthly changes in home prices are gaining steam as we move into the busier spring season. 

While one to two months doesn’t make a trend, the fact that all three reports show prices have stabilized is an encouraging sign for the housing market. The month-over-month data conveys a clear, but early, consensus that a national shift is taking place today. In essence, home prices are starting to tick back up.

Andy Walden, Vice President of Enterprise Research at Black Knight, says this about home price trends: 

“Just five months ago, prices were declining on a seasonally adjusted month-over-month basis in 92% of all major U.S. markets. Fast forward to March, and the situation has done a literal 180, with prices now rising in 92% of markets from February.”

Selma Hepp, Chief Economist at CoreLogic, explains the limited supply of homes available for sale is contributing to this positive turn:

“ . . . prices in many large metros appeared to have turned the corner, with the U.S. recording a second month of consecutive monthly gains. . . . The monthly rebound in home prices underscores the lack of inventory in this housing cycle.” 

Here’s What This Means for You 

  • Sellers: If you’ve been holding off on selling because you’re worried about what was happening with home prices and how it would impact the value of your home, it may be time to jump back in and partner with an agent to list your house. You don’t have to put your needs on hold any longer because the latest data shows a turn in your favor. 
  • Buyers: If you’ve been waiting to buy because you didn’t want to purchase something that would decrease in value, you now have the peace of mind things are looking up. Buying now lets you make your move before home prices climb more and gives you the chance to own an asset that typically grows in value over time. 

SBottom Line

If you put off your plans to move because you were worried about home prices falling, data shows the worst is already behind us and prices are actually rising nationally. Partner with a local real estate professional so you have an expert to explain what’s happening with home prices in your area.

Comments Off on The Worst Home Price Declines Are Behind Us

The Worst Home Price Declines Are Behind Us [INFOGRAPHIC]

The Worst Home Price Declines Are Behind Us [INFOGRAPHIC].

Some Highlights

While home prices vary by local area, they’ve already hit their low point nationally, and now they’re starting to rise again.

Last July, prices started to decline, but around February, they began climbing back up.

If you put your plans to move on hold waiting to see what would happen with home prices, reach out to a local real estate expert to discuss if now’s the right time to jump back in.

Comments Off on The Worst Home Price Declines Are Behind Us [INFOGRAPHIC]

A Recession Doesn’t Equal a Housing Crisis

A Recession Doesn’t Equal a Housing Crisis.

Everywhere you look, people are talking about a potential recession. And if you’re planning to buy or sell a house, this may leave you wondering if your plans are still a wise move. To help ease your mind, experts are saying that if we do officially enter a recession, it’ll be mild and short. As the Federal Reserve explained in their March meeting:

“. . . the staff’s projection at the time of the March meeting included a mild recession starting later this year, with a recovery over the subsequent two years.” 

While a recession may be on the horizon, it won’t be one for the housing market record books like the crash in 2008. What we have to remember is that a recession doesn’t always lead to a housing crisis.

To prove it, let’s look at the historical data of what happened in real estate during previous recessions. That way you know why you shouldn’t be afraid of what a recession could mean for the housing market today.  

A Recession Doesn’t Mean Falling Home Prices 

To show that home prices don’t fall every time there’s a recession, it helps to turn to historical data. As the graph below illustrates, looking at recessions going all the way back to 1980, home prices appreciated in four of the last six of them. So historically, when the economy slows down, it doesn’t mean home values will always fall.

Most people remember the housing crisis in 2008 (the larger of the two red bars in the graph above) and think another recession will be a repeat of what happened to housing then. But today’s housing market isn’t about to crash because the fundamentals of the market are different than they were in 2008. Back then, one of the big reasons why prices fell was because there was a surplus of homes for sale at the same time distressed properties flooded the market. Today, the number of homes for sale is low, so while home prices may see slight declines in some areas and slight gains in others, a crash simply isn’t in the cards. 

A Recession Means Falling Mortgage Rates

What a recession really means for the housing market is falling mortgage rates. As the graph below shows, historically, each time the economy slowed down, mortgage rates decreased.

Bankrate explains mortgage rates typically fall during an economic slowdown:

“During a traditional recession, the Fed will usually lower interest rates. This creates an incentive for people to spend money and stimulate the economy. It also typically leads to more affordable mortgage rates, which leads to more opportunity for homebuyers.” 

This year, mortgage rates have been quite volatile as they’ve responded to high inflation. The 30-year fixed mortgage rate has hovered between roughly 6-7%, and that’s impacted affordability for many potential homebuyers. 

But, if there is a recession, history tells us mortgage rates may fall below that threshold, even though the days of 3% are behind us.

SBottom Line

You don’t need to fear what a recession means for the housing market. If we do have a recession, experts say it will be mild and short, and history shows it also means mortgage rates go down.

Comments Off on A Recession Doesn’t Equal a Housing Crisis

Ways To Overcome Affordability Challenges in Today’s Housing Market [INFOGRAPHIC]

Ways To Overcome Affordability Challenges in Today’s Housing Market [INFOGRAPHIC].

Some Highlights

  • With so few homes on the market right now, widening the scope of your search to include nearby areas could help you find more options in your budget.
  • You can also work with a trusted lender to consider alternative financing options and search for down payment assistance.
  • If you’ve been searching for a home but are concerned about rising costs, make sure you have a team of trusted real estate professionals for expert advice.
Comments Off on Ways To Overcome Affordability Challenges in Today’s Housing Market [INFOGRAPHIC]

The Three Factors Affecting Home Affordability Today

The Three Factors Affecting Home Affordability Today.

There’s been a lot of focus on higher mortgage rates and how they’re creating affordability challenges for today’s homebuyers. It’s true that rates climbed dramatically since the record-low we saw during the pandemic. But home affordability is based on more than just mortgage rates – it’s determined by a combination of mortgage rates, home prices, and wages.

Considering how each one of these factors is changing gives you the full picture of home affordability today. Here’s the latest.

1. Mortgage Rates

While mortgage rates are higher than they were a year ago, they’ve hovered primarily between 6% and 7% for nearly eight months now (see graph below):

As the graph shows, mortgage rates have experienced some volatility during that time. And even a small change in mortgage rates impacts your purchasing power. That’s why it’s so important to lean on your team of real estate professionals for expert advice to stay up to date on what’s happening in the market. While it’s hard to project where mortgage rates will go from here, many experts agree they’ll likely continue to remain around 6%-7% in the immediate future. 

2. Home Prices

Over the past few years, home prices appreciated rapidly as the record-low mortgage rates we saw during the pandemic led to a surge in buyer demand. The heightened buyer demand happened while the supply of homes for sale was at record lows, and that imbalance put upward pressure on home prices. However, today’s higher mortgage rates have slowed down price appreciation.

And, the truth is, home price appreciation varies by market. Some areas are seeing slight declines while others have prices that are climbing. As Selma Hepp, Chief Economist at CoreLogic, explains:

“The divergence in home price changes across the U.S. reflects a tale of two housing markets. Declines in the West are due to the tech industry slowdown and a severe lack of affordability after decades of undersupply. The consistent gains in the Southeast and South reflect strong job markets, in-migration patterns and relative affordability due to new home construction.”

To find out what’s happening with prices in your local market, reach out to a trusted real estate agent.

3. Wages

The most positive factor in affordability right now is rising income. The graph below uses data from the Bureau of Labor Statistics (BLS) to show how wages have grown over time: 

Higher wages improve affordability because they reduce the percentage of your income it takes to pay your mortgage since you don’t have to put as much of your paycheck toward your monthly housing cost.

Home affordability comes down to a combination of rates, prices, and wages. If you have questions or want to learn more, reach out to a real estate professional who can explain what’s happening locally and how these factors work together.

SBottom Line

If you’re planning to buy a home, knowing the key factors that impact affordability is important so you can make an informed decision. To stay up to date on the latest on each, connect with a trusted real estate professional today.

Comments Off on The Three Factors Affecting Home Affordability Today

What Are the Experts Saying About the Spring Housing Market?

What Are the Experts Saying About the Spring Housing Market?.

The housing market’s been going through a lot of change lately, and there’s been uncertainty surrounding what will happen this spring. You may be wondering if more homes will go on the market, what’s next with home prices and mortgage rates, or what the best advice is for someone in your position right now.

Here’s what industry experts are saying right now about the spring housing market and what it means for you:

Selma Hepp, Chief Economist, CoreLogic:

We see more competition among buyers . . . Housing supply also tends to grow during the spring months. And this is also the time of year when relatively more migration happens, as people graduate and move elsewhere looking for jobs.”

Greg McBride, Chief Financial Analyst, Bankrate:

“I don’t expect big moves in prices in the span of a month, but like the flower buds of spring, the housing market is showing signs of improvement. A pick up in activity with inventory still low does bode well for home prices.”

Rick Sharga, Founder and CEO, CJ Patrick Company:

If you can find a home you love and can afford at today’s prices, don’t wait. Home prices in most of the country are unlikely to crash, and mortgage rates will only come down very gradually if they decline at all this year.” 

Jeff Tucker, Senior Economist, Zillow:

“The market is still much friendlier this spring for buyers who can overcome affordability hurdles, but buyers are going to see more competition than they might expect because there are not many homes on the market to go around. New listings are increasing, which they almost always do this time of year, but not nearly as quickly as usual.”

SBottom Line

If you’re thinking about selling your house, this spring’s a great time to do so while inventory is still so low. And if you’re in a good position to buy, lean on your team of expert advisors for the best advice. Whatever your plans, work with a real estate agent to make sure you’re able to navigate the spring housing market with confidence.

Comments Off on What Are the Experts Saying About the Spring Housing Market?
Style Selector
Select the layout
Choose the theme
Preset colors
No Preset
Select the pattern